
I wrote an article in 2013 entitled, “History’s investment lesson.” The article showed that in most years the stock market experiences at least one 10% drop during the year, but ends the year with an overall positive return. What’s unusual about the bull market since March 2009 is that we have not experienced these big, intra-year market drops for some time.
Fun facts for perspective
Perspective is always a good thing. To give some, let’s look at some fun facts about past market declines.
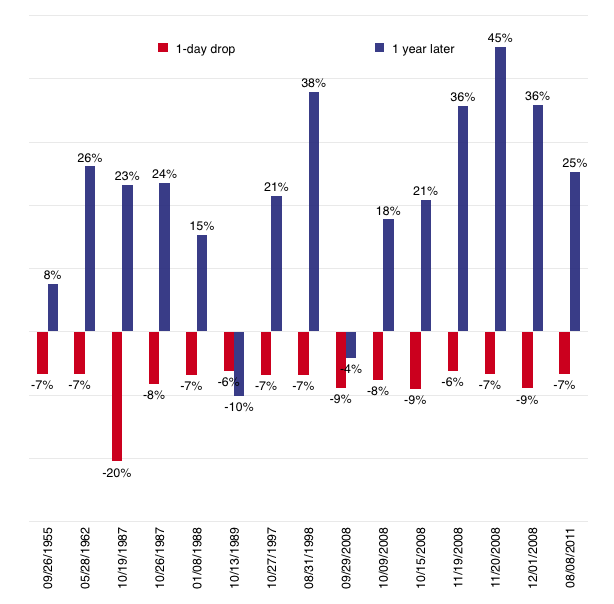
Wait a year — The chart below shows big, one-day drops in the S&P 500 — the kind of days that make anyone nervous. The red bars show the one-day drops. The blue bars show the recovery — S&P 500 Index one year after each respective one-day drop. Clearly, the patient investor who waited a year was rewarded most of the time.
S&P 500 Index Returns During and After Big Down Days
Spooky — Five of the seven worst percentage loss days for the S&P 500 in the last 65 years (i.e., dating back to 1950) occurred during the month of October (source: BTN Research).
Second to win — If Briton Lewis Hamilton holds his lead in this year’s Formula One World Championship, he’ll be the second Brit to win the World Driving Championship three times, joining the great Jackie Stewart. More British drivers, nine of them, have won the World Championship than drivers from any other country. Just checking to see if you’re paying attention. Back to investing …
Chasing last year’s best — An equal investment completed at the end of the trading day on Dec. 31, 2014, in the 10 best performing individual stocks within the S&P 500 from calendar year 2014 is up a collective 1.4 percent YTD through Aug. 31, 2015 (source: BTN Research)..
More than half the gain — The total return of the S&P 500 over the last five calendar years (2010-2014) is 105.1 percent (total return). The best 12 trading days during the five years (i.e., 12 days out of 1,258 total trading days) produced a 53.7 percent gain. Thus, 1 percent of trading days over the last five years were responsible for 51 percent of the index’s total return (source: BTN Research).
Bumps along the way
There’s no guarantee that the market will be positive by the end of this year, but market drops are normal. Investors can look to the past for guidance and comfort.
I hope you had a little fun looking at the information above. True, all the statistics in the world may not take the edge off of looking at your recent investment statements. But I feel the stock market, like an airplane, can handle turbulence. The difference between a successful investor and one less so is the ability to handle some bumps.
Let’s talk about your situation. We can see exactly where you stand and how best to proceed.
Note: Figures are rounded. The historical performance figures for the S&P 500 Index are for illustrative purposes only and are not intended to imply or guarantee future performance. The S&P 500 (Standard & Poor’s 500) is an unmanaged group of securities considered to be representative of the stock market in general. The index cannot be purchased directly by investors. Returns are average annualized returns. The illustration excludes the effects of taxes and brokerage commissions or other expenses incurred when investing. These returns were the result of certain market factors and events which may not be repeated in the future. Past performance is no guarantee of future results.